FEATURE
The Forecasting Tool Hidden Inside a Government Survey: A Practitioner’s Guide to the U.S. Census Bureau’s ‘Business Trends and Outlook Survey’
by Jennifer C. Boettcher
Picture a client who runs a midsize retail shop and wants to know whether to lock in a large inventory order before the holiday season. She’s heard that supply chains are tightening again, but she doesn’t know if that’s true for her industry, in her city, right now. The “Economic Census” won’t help—it’s 5 years old. The Bureau of Labor Statistics’ monthly report (“Employment Situation Summary”) covers the previous month.
What she actually needs is a window into what businesses like hers are experiencing today—and what they expect to happen 6 months from now. That window exists. It’s free, it’s updated every 2 weeks, and most information professionals have never used it.
The U.S. Census Bureau’s “Business Trends and Outlook Survey” (BTOS; census.gov/data/experimental-data-products/business-trends-and-outlook-survey.html is, on the surface, a high-frequency economic monitoring tool. But its most powerful and underappreciated feature is something different. It is a forward-looking instrument. For almost every metric it tracks, including business performance, changes in revenue, employment, hours worked, demand, prices, and AI adoption, the BTOS asks two questions in tandem: “What happened in the last 2 weeks?” and “What do you expect 6 months from now?” That paired architecture transforms the survey from a rearview mirror into something closer to a dashboard with a windshield. It is, to my knowledge, the only free government data source that systematically captures business owner expectations at the sector, subsector, state, and metropolitan level.
Why BTOS Is different
Before pulling numbers for a client, it helps to understand why the BTOS stands apart from traditional government data sources. Five qualities, taken together, make it genuinely distinctive.
- Timeliness. The BTOS releases data every 2 weeks, with only a 2-week lag between collection and publication. This is extraordinary by government statistical standards. The BTOS operates on a timescale that is actually useful for real-time decision making—and for catching turning points before they become headlines.
- Consistency. The survey asks the same core questions
in every biweekly cycle. This is not a limitation; it is a feature. Every datapoint is directly comparable to every prior datapoint, enabling clean trend analysis across months and years. Researchers can track how input prices in a subsector have moved since September 2023, or watch AI adoption rates climb in real time. The survey also periodically adds supplemental questions—on AI and specific causes of weather-related losses—that go deeper into certain topics without disrupting the core time series.
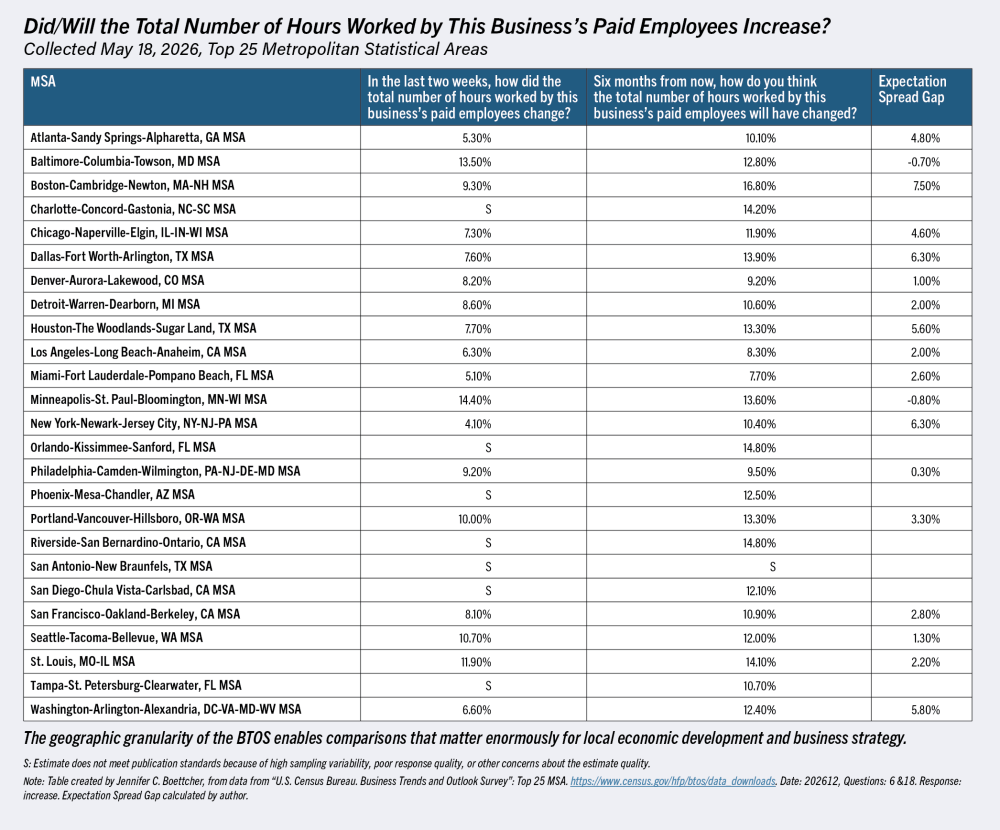
- Geographic granularity. The BTOS publishes data at three geographic levels: national, state, and the 25 most populous metropolitan statistical areas (MSAs). Most high-frequency economic surveys publish only national data. The BTOS lets researchers compare their city to states and nationally, or compare with other MSAs. These are questions that matter enormously for local economic development and business strategy.
- Industry depth. The BTOS covers most major North American Industry Classification System (NAICS) sectors and subsectors, publishing data at both the two-digit sector and the three-digit subsector levels. Aggregate national data can mask enormous variation at the industry level—the overall economy may be growing while a subsector is contracting. The BTOS lets researchers look inside the aggregate and find the story that actually applies to their client or community.
- Multiple access modes. BTOS data is available through interactive visualizations on the U.S. Census Bureau website, downloadable flat files (XLSX), a public API,
and through the Federal Statistical Research Data Centers. This range means the survey is useful to everyone, from a small business owner checking a chart on their phone to an academic economist running regression models on
the full microdata file. I’m creating a dashboard: btos.georgetown.domains.
And there’s a bonus: business size. The BTOS breaks results down by employment size class across seven brackets—from micro-firms with one to four employees up to enterprises with 250 or more. This granularity is a game changer for advisors supporting local economies, where the conditions facing a three-person shop and a 200-person manufacturer may be moving in opposite directions.
BTOS as a Predictive Instrument
The forward-looking architecture is the feature that deserves the most attention, yet it is one often overlooked in introductions to the survey.
Most major topics in the BTOS are covered by the two questions; one is anchored in the immediate past, and is one pointed toward the near future. The pairing is not incidental—it is the survey’s core design principle.
The raw values for current conditions are useful. But the most actionable intelligence in the BTOS comes from the gap between current conditions and 6-month expectations. This “expectation spread” is where real intelligence lives. When current conditions and expectations move in the same direction, the market is in a stable trend. When they diverge—when current conditions look healthy, but expectations are falling, or when current conditions are weak, but expectations are rising—that divergence is an early signal of a turning point. Because the BTOS is updated every 2 weeks, practitioners can watch these gaps open and close in near real time, well before the shift appears in any monthly or annual government report.
Here is a concrete example: A librarian is helping a client who owns multi-unit healthcare businesses. She pulls the BTOS subsector data for healthcare and social assistance (NAICS 62X) and filters for Questions 12 and 23—current input prices and expected input prices 6 months out. When business owners in this sector were surveyed on May 18, 2026, 55.7% reported that prices increased in the past 2 weeks, but 71.6% expected prices to increase in the next 6 months. That spread is a signal: Input cost pressure is not simply present; it is expected to intensify. The client should be thinking about locking in supplies now, not waiting.
The same logic applies across every paired topic:
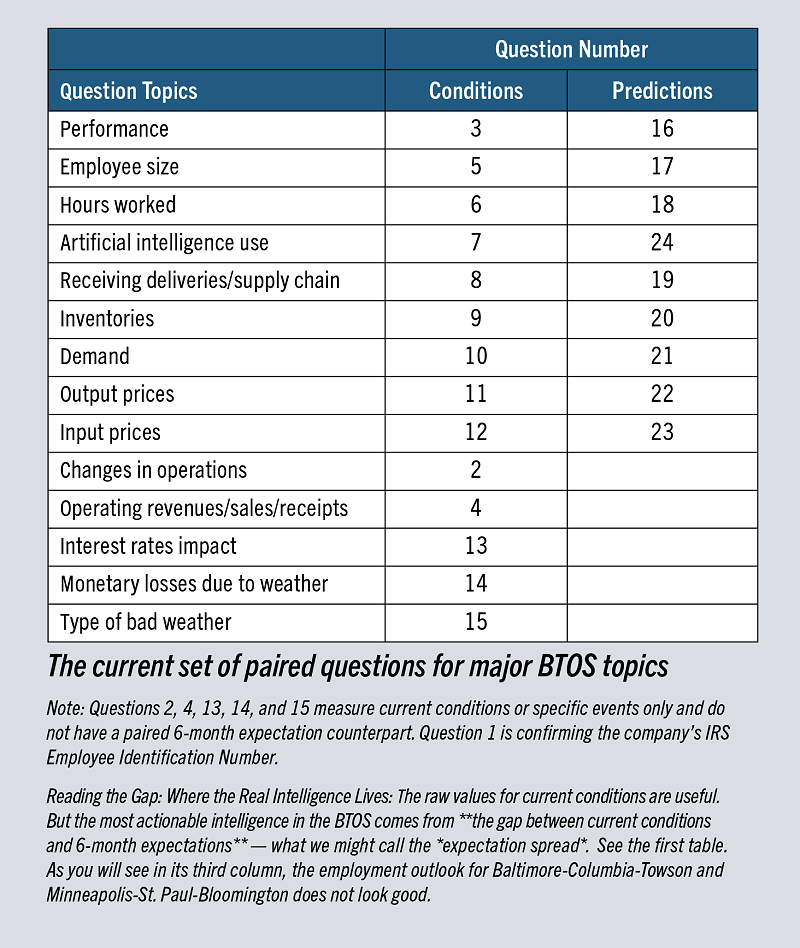
- Performance spread (Q3/Q16): Is current performance stable, but 6-month expectations are dropping? That’s an early warning to tighten cash reserves before the slowdown arrives.
- Employment spread (Q5/Q17): Are current headcounts flat, but 6-month hiring expectations are rising? That’s a signal of coming labor demand—useful for workforce development planners and community colleges designing training programs.
- Supply chain spread (Q8/Q19): Are current delivery times normal, but 6-month expectations are worsening? Now’s the time for a retailer to build buffer inventory, not after the delays materialize.
- Hours worked spread (Q6/Q18): Are hours currently declining but expected to recover? A staffing agency or temp firm would find this leading indicator invaluable for capacity planning.
Revelations About AI Adoption
No topic illustrates the BTOS’s forward-looking power better than AI. The paired AI questions—Q7 (current use) and Q24 (expected use in 6 months)—have produced a running, biweekly leading indicator of AI diffusion across the American business landscape that no other government source can match (census.gov/library/stories/2026/05/ai-use-businesses.html).
Between September 2023 and February 2024, the biweekly AI use rate rose from 3.7% to 5.4%, with an expected rate of approximately 6.6% by early fall 2024, as noted by Katherine Bonney’s research team (nber.org/papers/w32319). The 6-month expectation question (Q24) has consistently run ahead of the current-use question (Q7)—meaning the expectation spread for AI has been persistently positive since the questions were introduced. That persistent gap is itself a leading indicator: It tells practitioners that AI adoption will continue to accelerate, and that the gap between current adopters and non-adopters will widen.
AI adoption is not uniform. The Information sector and Finance and Insurance sector lead, with adoption rates of approximately 39.7% and 33.9%, respectively. Retail Trade, Manufacturing, and Wholesale Trade lag at roughly 14% or below. For practitioners advising clients in lagging sectors, the BTOS expectation data provides a concrete timeline; not “AI is coming” but “Here is when your sector’s peers expect to adopt, and here is what they plan to use it for.”
Bonney’s team also described the relationship between firm size and AI adoption as non-monotonic—it does not simply increase with firm size. Very small firms and very large firms both show relatively higher adoption rates, while midsize firms lag. The researchers hypothesize that very small firms adopt inexpensive, off-the-shelf tools (marketing automation, virtual assistants), while large firms deploy enterprise-scale AI. Midsize firms face the worst of both worlds: too large for consumer tools while lacking the IT resources of large enterprises.
Key Findings from the AI Supplement
The U.S. Census Bureau has conducted comprehensive AI supplements, asking all 1.2 million businesses in the frame rather than just the rotating panel, in 2023–2024 and again in 2025–2026. Here are the most recent findings:
- AI adoption has reached 18% of firms (32% employment-weighted), with worker-level use at 23% (41% employment-weighted).
- Firms with 250-plus employees report a 31% adoption rate, nearly double the 18% seen in microfirms
(1–10 employees).
- Most firms are minimalist adopters, utilizing AI in only 1 of 3 business functions.
- Labor impacts are dominated by augmentation rather than substitution; among firms shifting task structures, 66% engage exclusively in augmentation.
- AI-driven capital substitution (16%) is more than three times more common than AI-induced employment changes (5%).
- The most common reason for non-adoption remains,
“AI is not applicable to this business.”
That last finding is worth emphasizing. For a significant share of American businesses, particularly in trades, personal services, and local retail, AI tools simply don’t map onto core operations. The BTOS expectation data helps practitioners distinguish between clients who genuinely need to prepare for AI disruption and those for whom the urgency is overstated.
How to Access and Use the Data
Ready to work with BTOS data directly? Here is a practical workflow.
Step 1: Download the flat files. For any analysis beyond what the visualizations offer, download the flat files from census.gov/hfp/btos/data_downloads. Files are organized by national, state, MSA, sector, subsector, employment size class, and sector by employment size class files. Then do the following:
- Import the file into a spreadsheet application.
- Freeze row 1 and apply column filters.
- Filter for the specific question numbers and response categories you need using the paired question numbers in the table above.
- Check the Relative Standard Error (RSE) column. Values above 30% indicate estimates with high sampling variability.
- Use the Reference End Date column (not the collection date) for time-series analysis.
Step 2: Plot the spread. Once you have both the current conditions and the 6-month expectation for a given topic, plot them together on a single time series. The visual gap between the two lines—widening, narrowing, or crossing—is where the predictive story lives.
Step 3: Use the API for automated updates. The BTOS API allows researchers to build automated data pipelines that pull the latest release as soon as it is published. This is ideal for dashboards and monitoring tools that need to track the expectation spread across time without manual downloads. I will have a dashboard at btos.georgetown.domains.
Step 4: Cite correctly. Data citation is not optional—it is an ethical and professional obligation. The correct elements for a BTOS citation are as follows: Who is responsible for the data (U.S. Census Bureau); the title of the data program (“Business Trends and Outlook Survey”); the specific file downloaded (National, State, Top 25 MSA); the retrieval date and the URL; and a properly formatted APA citation: U.S. Census Bureau. (2025), “Business Trends and Outlook Survey,” National (Statistical Database), retrieved Nov. 25, 2025, from census.gov/hfp/btos/data_downloads.
Note also that federal government data is in the public domain. There is no copyright restriction on its use. But attribution through citation remains both a professional standard and an intellectual obligation. Understanding where your data comes from, and communicating that provenance to your clients and readers, is part of what makes information professionals indispensable.
Knowing the Limits
Responsible use of the BTOS requires understanding its limitations as clearly as its strengths.It is an experimental data product. The U.S. Census Bureau explicitly labels the BTOS as experimental, meaning the methodology is still being refined. Results should be interpreted with appropriate caution and are not subject to the same quality review processes as mandatory census surveys. As more people use BTOS, it will continue to be funded.
Nonresponse bias is a real concern. Businesses in severe financial distress may be less likely to complete a voluntary survey, which could mean the BTOS understates negative conditions during downturns. The expectation data is particularly susceptible to this bias: The businesses most likely to have pessimistic 6-month outlooks may be the least likely to respond.
It is not in data.census.gov. Unlike most U.S. Census Bureau products, BTOS data is not accessible through this standard interface. Researchers must go directly to the BTOS data portal and download flat files or use the API.
Visualizations cannot be downloaded. The interactive charts on the BTOS website are not downloadable. Researchers who want to create their own visualizations must download the underlying data files and build charts independently.
The AI Supplement only has National, State, and Sector data. The MSA, subsector, and employment granularity that makes the core BTOS so valuable is not available for the AI Supplement.
The BTOS excludes tax-exempt organizations, non-employer businesses, and farms. For researchers studying nonprofits, the gig economy, or agricultural businesses, the BTOS is not the right tool.
The BTOS asks businesses whether they are currently open or closed, but it cannot definitively identify businesses that have permanently closed, since permanently closed businesses stop responding. This creates survivorship bias: The expectation data reflects the views of businesses that are still operating, not those that have already failed.
As the survey matures, the U.S. Census Bureau periodically revises question order and content. The question numbers in this article reflect the current version as of mid-2026. Researchers building long time series should verify question numbering against the methodology documentation for each period covered.
Alternative access: William Judd, Abby Scheetz, and I plan to create a dashboard for BTOS using the API (btos.georgetown.domains).
LOOKING FORWARD TO ANTICIPATE CONDITIONS
The BTOS represents a genuine advance in the federal statistical system’s ability to monitor, as well as anticipate, conditions in the U.S. economy. Its experimental status, nonresponse limitations, and evolving methodology are real constraints that responsible practitioners must acknowledge. But they do not diminish what the survey actually is: a consistent, high-frequency, industry-specific, geographically granular, forward-looking window into business conditions that simply did not exist a decade ago.
For information professionals, the BTOS creates both an opportunity and a responsibility. The opportunity is to provide clients, students, and policymakers with near-real-time economic intelligence and, more importantly, with a structured view of where business owners themselves expect conditions to go. The responsibility is to use that data carefully: understanding the data, reading the expectation spread rather than just the current-conditions snapshot, citing the data correctly, and resisting the temptation to overstate the precision of what is, by design, a rapid-response survey rather than a definitive census.
Most economic data tells you where you’ve been. The BTOS tells you where businesses think they’re going. For the information professionals who sit between raw government data and the decisions that data should inform, this distinction is everything. The survey is available, it is free, and it is updated every 2 weeks. The only question is whether we use it.
The geographic granularity of the BTOS enables comparisons that matter enormously for local economic development and business strategy.
|